OHPC Hydro Power Plant

Consequent to the reform in power sector in Odisha, Odisha Hydro Power Corporation Ltd. (OHPC) was incorporated in 21 st April 1995 under the companies Act 1956. Its objective are:

To acquire, establish, operate, maintain, renovate, modernize in the State of Odisha and else while hydro electric generating stations, thermal and nuclear electric generating stations and any other electric generating stations based on any non-conventional sources of energy.
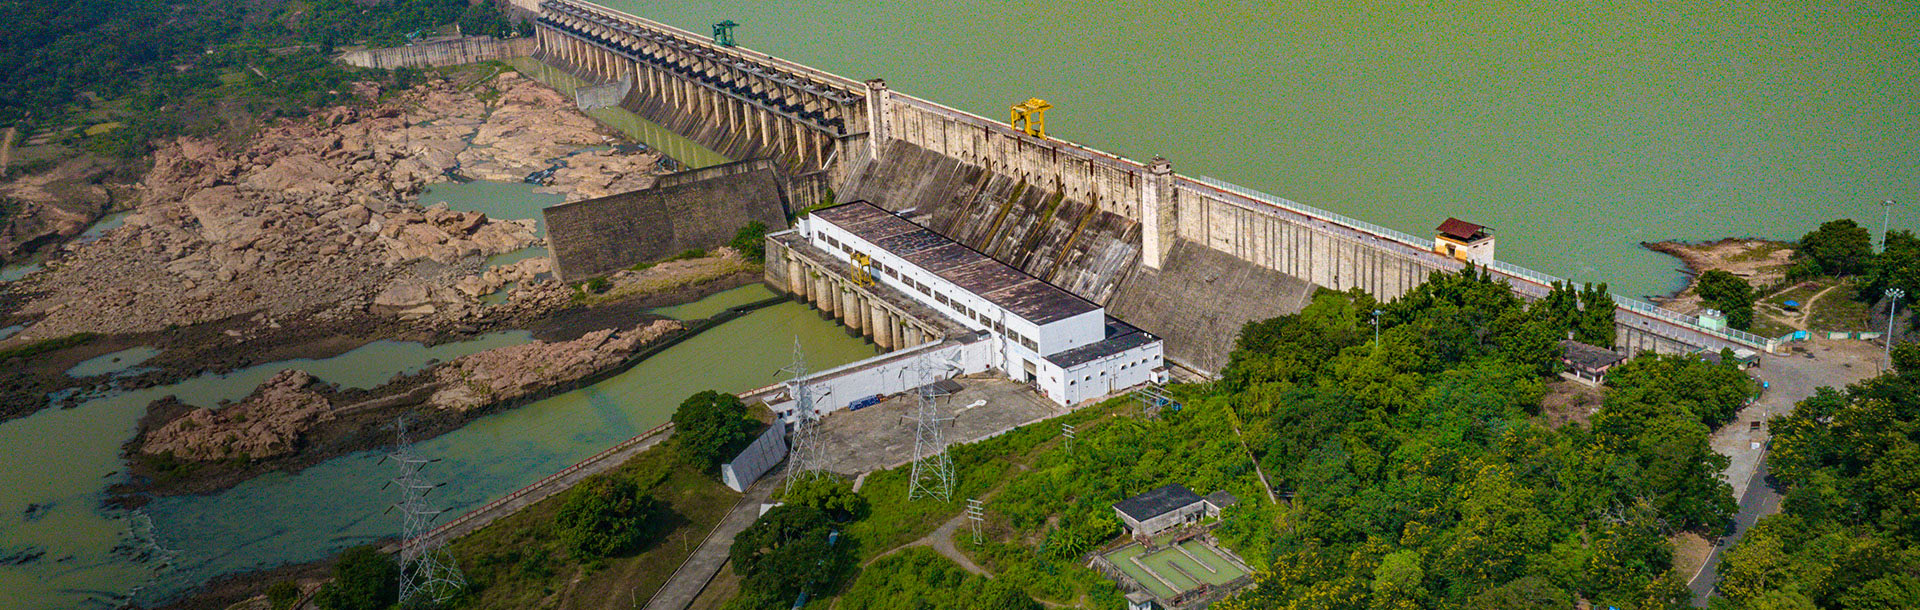
To carry on the business of purchasing, selling, importing, exporting, producing, trading, manufacturing or otherwise dealing in hydro electric power, thermal and nuclear electric power based on any non-conventional sources of energy.

To study, investigate, collect information and data, review operations, plan, research, design, prepare feasibility reports, prepare project reports, diagnose operational difficulties and weaknesses and advise on the remedial measures to improve and modernize existing stations and facilitate and to undertake for and on behalf of others the setting up of hydro electric power plants, thermal and nuclear electric power plants and any other power plants based on any non-conventional source of energy.

The objectives incidental or ancillary to the attainment of the main objects are to acquire business / companies for carrying on business of electric power, to acquire know-how, to carry on consultancy services in any field of activity in which it is engaged, to act as an entrepreneur on behalf of the Central or any State Govt.

Key Highlights

  • Incorporated under companies Act: 21.04.1995
  • Year of starting of commercial operation:1996-1997
  • Date of transfer of HydroPower Assets (excluding Machhkund): 01.04.1996
  • Transfer of Odisha share of Machhkund: ( 34.5 MW ) 01.04.1997
  • Installed capacity at the time of transfer of assets: 1272 MW
  • Present installed capacity (excluding MHEP share): 2099.8 MW
  • Design Energy (OHPC+Machhkund) (5676+262.50) MU
  • Peak capability. Between 800MW to 1800 MW
Summary of Performance of OHPC Design Energy for sale (MU)
Old units 3676.86
UIHEP 1942.38
Total 5619.24
Performance of OHPC
Yearwise Energy Sold (in MU) & Rate of Billing (Paise /KWh)
HHEP CHEP BHEP RHEP UIHEP UKHEP CSPDCL MHEP(Jt.) Scheme
Year Approved Saleable Design Energy (MU) Approved NAPAF (%) Approved E.C.R (Paisa/Unit) Approved A.E.C= A.C.C (Crores) Approved ARR (Crores) Energy Sold (MU) AEC Billed (Crores) PAF Achieved (%) ACC Billed (Crores) Total Billed (Crores) Surplus(+)/Deficit(-) (Crores) Year Approved Saleable Design Energy (MU) Approved NAPAF (%) Approved E.C.R (Paisa/Unit) Approved A.E.C= A.C.C (Crores) Approved ARR (Crores) Energy Sold (MU) AEC Billed (Crores) PAF Achieved (%) ACC Billed (Crores) Total Billed (Crores) Surplus(+)/Deficit(-) (Crores) Year Approved Saleable Design Energy (MU) Approved NAPAF (%) Approved E.C.R (Paisa/Unit) Approved A.E.C= A.C.C (Crores) Approved ARR (Crores) Energy Sold (MU) AEC Billed (Crores) PAF Achieved (%) ACC Billed (Crores) Total Billed (Crores) Surplus(+)/Deficit(-) (Crores) Year Approved Saleable Design Energy (MU) Approved NAPAF (%) Approved E.C.R (Paisa/Unit) Approved A.E.C= A.C.C (Crores) Approved ARR (Crores) Energy Sold (MU) AEC Billed (Crores) PAF Achieved (%) ACC Billed (Crores) Total Billed (Crores) Surplus(+)/Deficit(-) (Crores) Year Approved Saleable Design Energy (MU) Approved NAPAF (%) Approved E.C.R (Paisa/Unit) Approved A.E.C= A.C.C (Crores) Approved ARR (Crores) Energy Sold (MU) AEC Billed (Crores) PAF Achieved (%) ACC Billed (Crores) Total Billed (Crores) Surplus(+)/Deficit(-) (Crores) Year Approved Saleable Design Energy (MU) Approved NAPAF (%) Approved E.C.R (Paisa/Unit) Approved A.E.C= A.C.C (Crores) Approved ARR (Crores) Energy Sold (MU) AEC Billed (Crores) PAF Achieved (%) ACC Billed (Crores) Total Billed (Crores) Surplus(+)/Deficit(-) (Crores) Year Approved Saleable Energy (MU) Approved E.C.R (Paisa/Unit) Approved ARR (Crores) Total Billed (Crores) Year Actual Saleable Energy from MHEP(jt.) (MU) Targetted Odisha drawl from MHEP(jt.) (50% of total drawl (MU) Actual Odisha drawl (MU) Excess(+)/Short(-) (MU) Cost power billed @ 8.00 paisa/unit (Crores) O & M billed (Crores) Total billed (Crores)
2024-25 660.52 75 72.170 47.670 95.339 747.39 53.94 92.82 58.99 112.93 +17.591 2024-25 485.10 75 41.589 20.175 40.350 217.60 9.05 73.98 19.90 28.95 +8.775 2024-25 1171.17 87 41.000 48.018 96.035 1632.93 66.95 85.99 47.46 114.41 +18.375 2024-25 519.75 80 65.578 34.084 68.168 850.17 55.75 83.89 35.74 91.49 +23.322 2024-25 1942.38 88 41.675 80.948 161.896 1392.77 58.04 95.60 87.94 145.98 -15.916 2024-25 823.68 87 38.256 31.510 63.021 787.39 30.12 94.58 34.26 64.38 +1.359 2024-25 16.644 199.506 -- 3.279 2024-25 259.875 224.962 206.115 -18.847 -- 33.689 33.689
2023-24 660.52 75 69.820 46.120 92.240 833.74 58.21 91.07 56.00 114.21 +21.97 2023-24 485.10 75 39.700 19.260 38.520 294.70 11.70 99.56 25.57 37.27 +1.25 2023-24 1171.17 87 39.420 46.170 92.340 1012.07 39.90 89.92 47.72 87.62 -4.72 2023-24 519.75 80 67.82 35.250 70.500 754.79 51.19 85.03 37.47 88.66 +18.16 2023-24 1942.38 88 43.040 83.590 167.180 1687.00 72.61 91.79 87.20 159.80 -7.38 2023-24 823.68 87 38.250 31.510 63.020 565.33 21.62 80.30 29.08 50.71 -12.31 2023-24 16.644 219.674 -- 3.621 2023-24 259.875 415.662 386.127 -29.535 -- 28.555 28.555
2022-23 660.52 75 42.010 20.380 40.760 869.91 51.01 89.12 46.01 97.02 +56.26 2022-23 485.10 75 42.010 20.380 40.760 319.53 13.42 95.87 26.05 39.47 -1.29 2022-23 1171.17 87 33.120 38.790 77.590 980.72 32.48 86.72 38.67 71.15 -6.44 2022-23 519.75 80 75.450 39.210 78.430 732.53 55.27 70.81 34.71 89.98 +11.55 2022-23 1942.38 88 42.630 82.810 165.620 1351.49 57.61 94.07 88.52 146.14 -19.48 2022-23 823.68 87 37.300 30.730 61.450 531.94 19.84 93.34 32.97 52.81 -8.64 2022-23 16.644 182.598 -- 3.001 2022-23 259.875 358.043 254.228 -3.815 -- 28.562 28.562
2021-22 677.16 75 63.150 42.760 85.520 684.28 43.21 69.00 39.34 82.55 -2.97 2021-22 485.10 75 37.010 17.950 35.910 263.24 9.74 98.69 23.60 33.34 -2.57 2021-22 1171.17 83 32.440 38.000 75.990 1001.96 32.50 70.11 32.10 64.60 -11.39 2021-22 519.75 80 64.050 33.290 66.580 837.92 53.67 68.40 28.46 82.13 +15.55 2021-22 1942.38 88 44.030 85.520 171.040 1124.80 49.52 87.90 85.43 134.95 -36.09 2021-22 823.68 87 40.460 33.320 66.650 440.01 17.80 85.87 32.89 50.69 -15.96 2021-22 16.644 180.003 -- 2.959 2021-22 259.875 345.757 315.241 -30.516 -- 27.172 27.172
2020-21 677.16 75 59.678 38.798 87.595 597.39 38.64 40.82 23.84 62.48 -25.115 2020-21 485.10 75 37.347 18.117 36.234 322.37 12.04 85.45 20.64 32.68 -3.554 2020-21 1171.17 83 32.976 38.621 77.241 1594.30 52.57 60.32 28.07 80.64 +3.399 2020-21 519.75 80 64.672 33.613 67.227 980.77 63.43 80.90 33.99 97.42 +30.193 2020-21 1942.38 88 46.071 89.488 178.975 1713.10 78.92 91.49 93.04 171.96 -7.015 2020-21 823.68 87 40.244 33.148 66.296 771.26 31.04 68.84 26.25 57.27 -9.026 2020-21 16.644 200.92 -- 3.339 2020-21 259.875 319.296 298.974 -20.322 0.611 20.649 21.260
2019-20 677.16 75 75.503 51.127 85.640 502.32 31.76 41.28 23.57 55.33 -30.31 2019-20 485.10 75 37.030 13.187 35.930 228.67 8.47 -- 15.56 24.03 -11.9 2019-20 1171.17 83 42.955 50.307 71.090 1482.02 44.98 73.58 31.50 76.48 +5.39 2019-20 519.75 80 62.890 32.690 65.380 647.71 40.73 77.01 31.47 72.20 +6.82 2019-20 1942.38 88 44.260 85.970 171.990 2188.21 96.85 89.12 87.06 183.91 +11.97 2019-20 823.68 87 38.237 31.495 62.990 813.04 31.08 72.23 26.14 57.22 -5.77 2019-20 16.644 226.99 -- 3.741 2019-20 259.875 322.090 306.549 -15.541 0.913 19.590 20.503
2018-19 677.16 78 75.503 51.128 102.255 354.59 26.77 34.40 22.55 49.32 -52.935 2018-19 485.10 75 27.597 13.388 26.775 154.89 4.27 54.67 9.76 14.03 -12.745 2018-19 1171.17 83 42.955 50.308 100.615 1647.95 70.79 87.75 53.19 123.98 +23.365 2018-19 519.75 75 61.410 31.918 63.835 724.65 44.50 80.85 34.41 78.91 +15.075 2018-19 1942.38 88 40.179 78.042 156.084 2098.39 84.31 86.42 76.64 160.95 +4.866 2018-19 823.68 87 29.162 24.020 48.040 903.09 26.34 73.19 20.21 46.54 -1.5 2018-19 16.644 204.75 -- 3.356 2018-19 259.875 284.573 273.713 -10.860 0.942 16.497 17.439
2017-18 677.16 78 72.360 48.999 97.998 584.43 42.29 69.01 43.35 85.64 -12.358 2017-18 485.10 75 26.638 12.923 25.895 214.51 5.71 58.31 10.05 15.76 -10.085 2017-18 1171.17 83 41.252 48.314 96.627 1447.80 59.72 81.96 47.71 107.43 +10.803 2017-18 519.75 75 59.101 30.718 61.435 738.10 43.62 72.02 29.50 73.12 +11.685 2017-18 1942.38 88 38.748 75.263 150.525 1709.94 66.26 99.65 80.95 147.21 -3.315 2017-18 823.68 87 27.872 22.958 45.916 657.12 18.31 65.06 17.17 35.48 -10.436 2017-18 16.644 194.81 -- 3.219 2017-18 259.875 245.099 239.727 -5.372 1.301 13.326 14.627
2016-17 677.16 78 70.013 47.410 94.820 505.93 35.42 74.00 44.98 80.40 -14.42 2016-17 485.10 75 26.848 13.024 26.047 196.89 5.29 88.53 15.38 20.66 -5.387 2016-17 1171.17 83 45.261 53.008 106.016 983.31 44.50 86.56 55.28 99.79 -6.226 2016-17 519.75 75 58.039 30.167 60.333 532.07 30.88 85.69 34.47 65.35 +5.017 2016-17 1942.38 88 37.679 73.187 146.373 1472.08 55.47 83.96 69.83 125.30 -21.073 2016-17 823.68 87 27.432 22.597 45.194 603.53 16.56 83.11 21.58 38.14 -7.054 2016-17 16.644 195.64 -- 3.204 2016-17 259.875 357.612 349.835 -14.777 1.238 13.109 14.347
2015-16 677.16 78 66.269 44.875 89.75 427.51 28.33 79.75 45.59 73.92 -15.83 2015-16 485.10 75 24.366 11.820 23.64 211.63 5.16 75.03 11.82 16.98 -6.66 2015-16 1171.17 83 44.754 52.415 104.83 578.00 25.87 74.58 47.10 72.97 -31.86 2015-16 519.75 75 56.411 29.335 58.67 583.17 32.91 85.78 33.55 66.46 +7.79 2015-16 1942.38 88 36.937 71.745 143.49 1590.99 58.77 96.00 78.26 137.03 -6.46 2015-16 823.68 87 26.461 21.795 43.59 712.80 18.86 92.48 23.17 42.03 -1.56 2015-16 16.644 149.81 -- 2.456 2015-16 259.875 288.451 280.259 -8.192 2.429 9.987 12.416
2014-15 677.16 78 63.818 43.215 86.43 548.16 34.98 65.21 36.13 71.11 -15.32 2014-15 485.10 75 24.025 11.655 23.31 277.10 6.66 61.47 9.55 16.21 -7.1 2014-15 1171.17 83 44.105 51.655 103.31 1240.93 54.73 75.38 46.92 101.65 -1.66 2014-15 519.75 75 54.045 28.090 56.18 710.10 38.38 85.00 31.84 70.21 +14.03 2014-15 1942.38 88 40.708 78.100 156.20 2597.73 104.43 94.28 83.67 188.10 +31.90 2014-15 823.68 87 24.918 20.525 41.05 702.70 17.51 92.55 21.83 39.34 -1.71 2014-15 16.644 127.64 -- 2.084 2014-15 259.875 288.160 284.989 -3.171 1.538 10.823 12.361
2013-14 677.16 78 46.267 31.330 62.66 669.71 30.98 79.75 32.03 63.02 +0.36 2013-14 485.10 75 26.097 12.665 25.33 306.17 7.99 76.65 12.94 20.93 -4.4 2013-14 1171.17 85 35.562 41.655 83.31 1631.96 58.04 72.56 35.55 93.59 +10.28 2013-14 519.75 75 39.230 20.390 40.78 885.47 34.74 84.83 23.06 57.80 +17.02 2013-14 1942.38 88 40.259 78.205 156.41 2445.11 98.44 96.58 85.82 184.26 +27.85 2013-14 823.68 85 17.670 14.565 29.13 852.31 15.06 86.85 14.56 29.62 +0.49 2013-14 16.644 92.53 -- 1.508 2013-14 259.875 271.111 235.118 -36.293 0.578 7.383 7.961
2012-13 677.16 78 46.437 31.445 62.89 664.12 30.84 74.25 29.93 60.77 -2.12 2012-13 485.10 75 26.232 12.725 25.45 276.59 7.25 73.00 12.39 19.64 -5.81 2012-13 1171.17 85 36.908 43.225 86.45 528.51 19.51 84.18 42.81 62.32 -24.13 2012-13 519.75 75 36.392 18.915 37.83 691.58 25.17 76.33 19.25 44.42 +6.59 2012-13 1942.38 88 39.632 76.980 153.96 1637.33 64.89 86.09 75.31 140.20 -13.76 2012-13 823.68 85 18.363 15.125 30.25 453.79 8.33 88.53 15.75 24.08 -6.17 2012-13 16.644 92.87 -- 1.52 2012-13 259.875 266.726 250.561 -16.165 0.774 7.951 8.675
2011-12 677.16 78 44.546 30.165 60.33 649.91 28.95 57.66 22.30 51.25 -9.08 2011-12 485.10 75 25.036 12.145 24.29 326.89 8.18 80.93 13.10 21.28 -3.01 2011-12 1171.17 85 35.896 42.040 84.08 1021.02 36.65 73.72 36.46 73.11 -10.97 2011-12 519.75 75 34.661 18.015 36.03 846.73 29.35 81.04 18.70 48.05 +12.02 2011-12 1942.38 88 38.605 74.985 149.97 1382.95 53.39 97.01 82.67 136.06 -13.91 2011-12 823.68 85 16.651 13.740 27.46 593.20 9.89 94.61 15.30 25.19 -2.29 2011-12 16.644 89.10 -- 1.472 2011-12 259.875 227.034 224.002 -3.032 1.071 5.961 7.032
2010-11 677.16 78 44.775 30.32 60.64 655.47 29.35 77.63 30.17 59.52 -1.12 2010-11 485.10 75 23.49 11.395 22.79 250.02 5.87 82.75 12.50 18.37 -4.42 2010-11 1171.17 85 29.201 34.20 68.40 1261.96 36.85 81.10 32.63 69.48 +1.08 2010-11 519.75 75 34.545 17.955 35.41 233.12 8.74 79.24 15.34 24.08 -11.83 2010-11 1942.38 88 37.793 73.41 146.82 1632.50 61.70 92.06 76.80 138.50 -8.32 2010-11 823.68 85 16.584 13.660 27.32 553.11 9.47 84.77 13.62 22.80 -4.52 2010-11 16.644 89.54 -- 1.487 2010-11 259.875 279.617 268.438 -11.379 -- -- --
2009-10 -- -- -- -- -- -- -- -- -- -- -- 2009-10 -- -- -- -- -- -- -- -- -- -- -- 2009-10 1171.17 85 28.33 33.18 66.36 767.16 21.73 86.01 35.57 55.31 -11.05 2009-10 519.75 75 29.11 15.13 30.26 529.63 15.42 68.80 13.45 28.87 -1.39 2009-10 1942.38 88 36.68 71.235 142.47 1414.75 51.89 96.49 78.11 130.00 -12.47 2009-10 823.68 85 12.60 10.375 20.75 399.13 5.03 90.61 11.06 16.09 -4.66 2009-10 16.644 64.96 -- 1.079 2009-10 259.875 284.674 285.928 -3.746 -- -- --
As onEquity (Rs in Crores)Loan (Rs in crores)Debt: Equity ratio
Equity share capitalOther Equity (Reserves & Surplus)Total EquityPFCState Govt.Total Loan
31.03.2025833.192026.902,860.090.00849.67849.670.30
31.03.2024833.191780.922,614.110.00870.90870.900.34
31.03.2023833.191,612.932,446.120.00910.13910.130.37
31.03.2022833.191,261.722,094.910.00940.36940.360.45
31.03.2021833.191,195.562,028.750.00970.59970.590.48
31.03.2020810.651,073.611,884.260.001,000.821,000.820.53
31.03.2019761.651,005.901,767.560.001,031.051,031.050.58
31.03.2018712.65923.141,635.790.001,061.281,061.280.65
31.03.2017693.65893.771,587.420.001,091.511,091.510.69
31.03.2016638.65834.421,473.0714.071,121.741,135.810.77
31.03.2015339.80906.961,246.7633.041,151.971,185.010.95
31.03.2014320.80687.141,007.9449.701,743.401,793.101.78
31.03.2013320.80681.621,002.4265.551,743.401,808.951.80
31.03.2012320.80624.31945.1180.041,743.401,823.441.93
31.03.2011 320.80597.89918.6989.291,743.401,832.69 1.99
31.03.2010 320.80562.17882.97106.581,743.401,849.982.10
31.03.2009320.80532.15852.95154.411,743.401,897.812.22
31.03.2008320.80514.20835.00203.621,743.401,947.022.33
31.03.2007320.80313.30634.10254.631,782.602,037.233.21
31.03.2006320.80255.73576.53228.621,782.602,011.223.49
31.03.2005320.80286.11606.91252.621,801.602,054.223.38
31.03.2004320.80228.42549.22274.791,802.602,077.393.78
31.03.2003320.80222.23543.03286.321,802.602,088.923.85
31.03.2002320.80265.90586.70302.991,804.452,107.443.59
31.03.2001320.80250.79571.59345.771,783.592,129.363.73
31.03.2000320.80278.07598.87382.431,717.012,099.443.51
31.03.1999320.80202.53523.33312.241,650.431,962.673.75
31.03.1998320.80147.16467.96209.481,583.851,793.333.83
31.03.1997320.8069.22390.02146.551,450.691,597.244.10
31.03.199620.000.0020.000.006.056.050.30
OHPC Financial Position As on 31.03.2019
(Rs. in Lakhs)
YearGross Generation in MUSale of Energy in MUSale of EnergyTotal incomeCumulative profit As per IND ASShare Capital
2024-255777.8605644.68655365.7697812.42129689.6383319.07
2023-245290.9315164.09653785.2289586.28168092.0983319.07
2022-234,917.5004,802.55949935.0768525.65151292.8483,319.07
2021-224,481.7764,368.65845427.4956230.31116172.1083,319.07
2020-216,130.415,999.3351959.7166435.22109556.2283,319.07
2019-206,004.235,878.4447156.2968165.4797360.6281,065.07
2018-196,031.6625,897.18448008.7865216.9190590.4576,165.07
2017-185,487.2655,370.91346848.3063023.3482313.6971,265.07
2016-174,433.1964,310.02343249.0459934.4379377.0469,365.07
2015-164,262.8784,120.64541912.7561633.9473441.8963,865.07
2014-156,238.4576,092.16049324.1262483.6980696.333,980.07
2013-146,967.9786,807.03045173.4164774.1656813.6232,080.07
2012-134,389.0954,242.27335311.9844558.2656261.632,080.07
2011-124,971.9074,837.09835868.4446040.7350531.0432,080.07
2010-114,756.4574,622.52333871.5439,358.0047817.4432,080.07
2009-103,919.6893,802.00929615.8936689.9644060.0732,080.07
2008-095,801.9045,637.96332916.139348.841345.3332,080.07
2007-087,850.2637,733.81238604.0442897.9339588.2432,080.07
2006-077,175.3217,065.16230365.1932085.3127448.8332,080.07
2005-065,030.2144,928.60420846.2422420.0622056.0832,080.07
2004-056,868.2976,725.73027494.3730176.8124473.4232,080.07
2003-045,951.3735,796.03923033.6223729.818568.0932,080.07
2002-033,132.7103,025.42017140.8117927.5617998.2932,080.07
2001-026,448.0206,310.86021525.6922302.822190.2832,080.07
2000-014,598.6104,440.98023376.3124650.8922578.8732,080.07
1999-004,531.7664,373.41821975.3723253.9225323.1232,080.07
1998-993,391.4303,280.19316004.8116430.9220284.9932,080.07
1997-983,313.0003,538.06817336.5317548.0514764.3532,080.07
1996-973,671.0003,625.95013778.6014542.996985.5332,080.07
1995-96----0002,000.07

Accessibility Adjustments

Content Adjustments

Decrease Font Size
Default Font Size
Increase Font Size
Highlight Titles
Text Magnifier

Color Adjustments

Light Contrast Theme
Dark Contrast Theme
High Contrast
Monochrome
Adjust Text Colors
High Saturation
Adjust Title Colors

Orientation Adjustments

Hide Images
Highlight Hover
Big Black Cursor
Big White Cursor